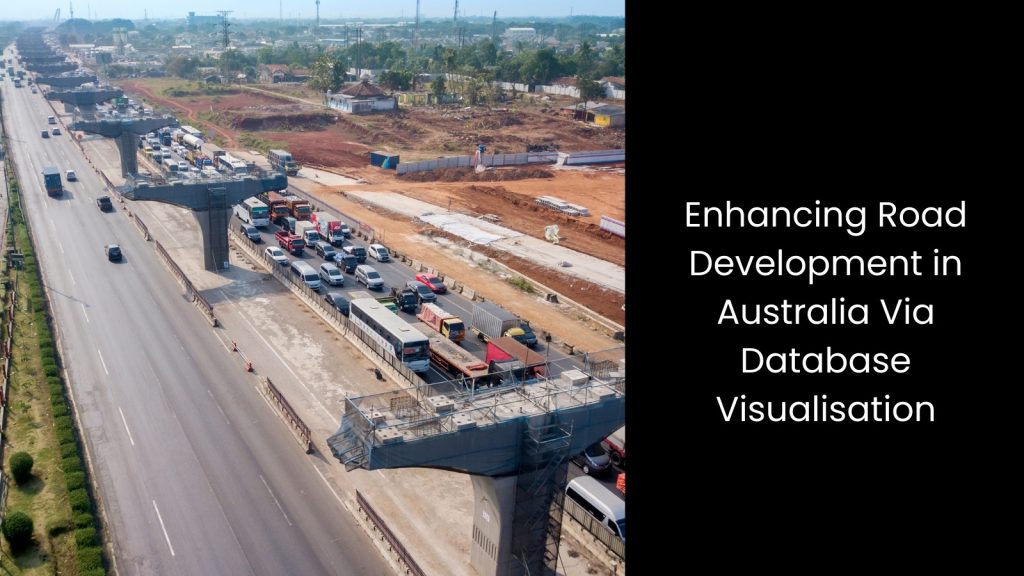
Did you know that the federal government is usually responsible for the national highway system in Australia? Yes, when the highway framework proceeds like that, the state highways and main roads are controlled and funded by the state and territory government agencies. Apart from that, those local governments are responsible for managing local roads. Though it is divided into states and according to the complexity of the infrastructure, everything comes under one aspect, which is ‘Road Development’. In recent years, many tools and modern technologies have been identified by the road development authorities in Australia in order to streamline their workload. One such tool is ‘Database Visualisation’, which brings everything together on one screen.
In this article, we will focus on the employment of database visualisation tools for the betterment of road development projects in Australia.
In this article, we will focus on the employment of database visualisation tools for the betterment of road development projects in Australia.
We will reveal
- What is Database Visualisation?
- Top 5 Reasons Why Road Development Australia Needs Database Visualisation
- Enhanced Data Interpretation
- Accident Analysis
- Predictive Analytics and Preventive Maintenance
- Cross-Department Collaboration
- Real-Time Insights
3. Enhancing Road Development in Australia Via Database Visualisation
What is Database Visualisation?

- This is a modern-era strategic approach, which is the process of converting complex data into visual formats. If put simply, all the data gathered under one consolidated platform can be indicated through visual mediums like charts, graphs, maps, and dashboards.
- This makes it easier to understand and interpret the information quickly. In the development and industrial worlds, visualising data receives much attention as it helps stakeholders in various ways. They can use this data visualisation in order to make informed decisions, spot trends, and identify potential issues before they become major problems.
- Why does this gain so much popularity in modern days? Without database visualisation, data remains raw, usually in overwhelming formats that are hard for the parties involved to analyse. This will lead to poor decision-making and inefficiencies.
- Then, what occurs when a database transforms into a visualisation mode? It is not that complicated to understand. The mechanism of database visualisation involves collecting data, processing it, and then using software tools to create visual representations.
- These tools can update visuals in real-time, providing up-to-date insights. For instance, in road development, visual data can show traffic patterns and accident hotspots, helping to prioritise projects and improve safety.
Top 5 Reasons Why Road Development Australia Needs Database Visualisation

Enhanced Data Interpretation
What if the road development authorities keep receiving raw data all the time? How can they know what is indicated through them? This is why data interpretation is required to make smart decisions about where and how to build and maintain roads. Without proper data interpretation, they face challenges like misallocating resources, missing critical safety issues, and inefficiently planning projects, which can lead to wasted money and unsafe roads.
This is one aspect in which road development parties need database visualisation. Enhanced data interpretation through the latter helps address these problems by turning complex data into easy-to-understand visuals like charts and maps. This allows authorities to quickly see patterns and trends, such as areas with high traffic congestion or frequent accidents, so they can prioritise projects that need immediate attention.
For example, a visualised map showing accident hotspots can help authorities focus on improving safety in those areas. This process involves collecting raw data, processing it, and using specialised software to create visual representations.
These visuals provide clear and actionable insights, making it easier for road development teams to plan effectively and communicate their plans to stakeholders.
Accident Analysis
Although Australia has a high-end road infrastructure network, it has also experienced a huge improvement in road accidents. Road development authorities need accident analysis to understand where and why accidents occur. This way, they can make the roads safer. Without accurate accident analysis, they face challenges like being unable to identify high-risk areas, which means they cannot prioritise safety improvements effectively. This can lead to more accidents, injuries, and even fatalities, for sure.
This is where accident analysis becomes the main reason why road development companies need database visualisation. As you can see, it turns raw accident data into clear visuals like heat maps and charts. Then it has the ability to show where accidents happen most frequently and what factors are involved.
These visuals make it easier for road planners to spot patterns and make informed decisions about where to install safety measures like better signage, traffic lights, or road redesigns.
Predictive Analytics and Preventive Maintenance
Maintenance is the number-one concern when it comes to road development in any country. Do you agree with this statement? Authorities prioritise maintenance to keep roads in good condition and safe for drivers. When database visualisation tools come out with predictive analytics and preventive maintenance capacities, their value is unlimited!
Without accurate predictive analytics and preventive maintenance, authorities face challenges like unexpected road failures, higher repair costs, and unsafe driving conditions. These problems can lead to more accidents and expensive emergency repairs.
Visualisation tools turn complex data into easy-to-understand graphs and charts, helping authorities see when and where roads might need attention. The visual trend lines might show increasing wear on a particular road, signalling that it is time for maintenance before it gets worse.
This process involves collecting data on road conditions, processing it, and using software to create visual predictions. These visuals help road development teams plan maintenance schedules and allocate resources efficiently, ensuring roads remain safe and in good condition.
Cross-Department Collaboration
Road safety or the development of infrastructure cannot be handled single-handedly. It is the result of the teamwork of various responsible parties.
This is why the authorities need cross-departmental collaboration to ensure that all aspects of road projects are well-coordinated and efficient. Without collaboration, departments will work alone. This will lead to miscommunication, duplicated efforts, and overlooked issues, which can delay projects and increase costs.
When it comes to database visualisation it enables different teams, such as engineers, planners, and safety officers, to share and understand data easily. Visualisation tools turn complex data into clear, visual formats like dashboards and maps, which can be accessed by all departments.
This is a long process, as you can see. This ranges from collecting data from various sources, processing it, and using software to create visual displays that everyone can understand to practically using them. The best benefit of these visuals is that they help different teams stay on the same page, coordinate their efforts, and make informed decisions together.
Ultimately, this is what leads to more efficient and successful road development projects for Australia.
Real-Time Insights
It is necessary for the road development authorities to have real-time insights to make timely and informed decisions about road projects and maintenance.
Without real-time insights, they face challenges like delayed responses to issues, outdated information, and inefficient resource use. These situations will lead to safety issues and higher costs. Real-time insights become the main reason why Road Development Australia needs database visualisation. These tools can display up-to-date information instantly through dashboards, charts, and maps, where they are simplified.
This process involves continuously collecting data from various sources, such as traffic sensors and weather reports, and using software to update visual displays in real-time. These visuals help authorities monitor current conditions, detect problems as they arise, and respond quickly.
For example, real-time traffic data can highlight congestion areas, allowing for immediate traffic management interventions.
Enhancing Road Development in Australia Via Database Visualisation

As you can see, enhancing road development in Australia is a complicated process for sure. Database visualisation is one method that the authorities can make use of when it comes to simplifying information, expediting processes, and keeping every stakeholder on the same page. However, it is also important to employ software that has embedded tools like database visualisation. Purchasing them from a reputed supplier will take your reliability worries away.


