Australia is desperately in need of robust technology to present its geographic data, as the nation itself is a fusion of different climates and lands. This is why the authorities put a lot of weight on data visualisation. ‘Thematic maps’, as one of the major methods of visual representations of geographic data, enter the scenario to offer invaluable insights for understanding Australia’s complex and diverse landscape. As they effectively communicate spatial patterns and relationships, these maps serve as invaluable tools for the authorities in Australia.
This article will help you understand the key benefits of Thematic Maps for Australia.
This article will help you understand the key benefits of Thematic Maps for Australia.
What are Thematic Maps?
- These are a sort of specialised tool used to display specific types of information about a geographic area. Why is it different from the other maps?
- Unlike general maps that show roads, cities, and physical features, thematic maps focus on particular themes or topics. These themes can include various types of data, such as population density, climate patterns, land use, or economic activities.
- The main advantage of thematic maps is that they make complex data easier to understand by presenting it visually. For instance, a thematic map showing population density might use different colours to represent how many people live in different areas, helping its viewers quickly see which regions are more crowded. Another example is a map illustrating climate patterns, which can show temperature ranges or rainfall amounts across different regions. This helps the relevant people understand how weather varies from one place to another.
- The strengths of this do not end there! Thematic maps can also reveal trends and patterns that are not immediately obvious from other types of maps or data sources. Just by looking at a thematic map of land use, authorities can see how different areas are used for farming, industry, or residential purposes, which helps in urban planning and development.
- It is pretty obvious that these maps are valuable for making decisions, such as where to build new infrastructure or how to allocate resources. They also aid in research by providing a clear visual representation of data, making it easier to analyse and compare the information.
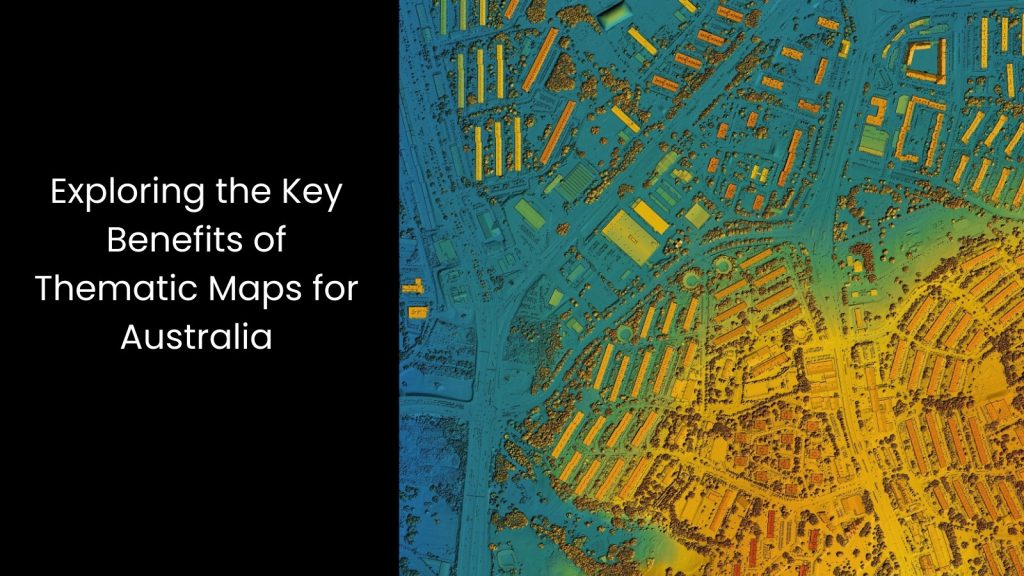
Exploring the Key Benefits of Thematic Maps for Australia
Offering Education and Awareness
It is certainly a key benefit of thematic maps for the Australian landscape.
You know that these maps serve as valuable educational tools as they visually present important data about various issues, such as climate change impacts or historical land use changes. If we take an example, we can see a thematic map showing climate change effects that can highlight how rising temperatures or changing rainfall patterns affect different regions of Australia. This helps the Australian weather department or any other industry like road development or urban development understand the specific impacts on their local environment, such as the increased risk of droughts or floods.
Plus, the latter illustrates historical land use changes, showing how land has been used over time for various purposes. This helps the responsible parties see how land use patterns have evolved and what effects these changes might have had on local ecosystems and communities.
As it is possible to present complex data in an easy-to-understand visual format, thematic maps make it simpler for people to grasp important regional challenges. These maps also support educators by providing clear, engaging resources that can enhance lessons on geography, environmental science, or history. They make it easier for students and the public to visualise and analyse data, leading to a deeper understanding of issues that affect their region.
Enhanced Data Visualisation
It works like this: These maps excel at visually representing specific data sets, such as population density, climate patterns, or land use, as we already mentioned. As they focus on a particular theme, thematic maps transform complex information into clear, easily understandable visuals.
Did you know a thematic map can show population density using colours or shading to indicate how many people live in different areas of Australia? Yes, this capacity makes it easy to see where the most crowded and sparsely populated regions are without needing to sift through raw numbers. Similarly, a thematic map displaying climate patterns can illustrate temperature ranges or rainfall amounts across different parts of the country. This helps anyone quickly grasp how climate varies from one area to another, which is crucial for understanding local weather conditions and preparing for climate-related challenges.
Another important use of thematic maps is showing land use, which helps in planning and managing land resources by showing where different types of land use occur and how they might impact the environment.
Making Research and Analysis Easy
Researchers and analysts use these maps to study various phenomena, such as environmental changes, socioeconomic conditions, etc. As we can see, it helps them conduct more detailed and location-specific research.
Let us explain this by giving an example. The latter shows environmental changes can highlight areas affected by deforestation, soil erosion, or climate change. This allows scientists to see how these issues vary across different regions of Australia and identify areas that need urgent attention. In the same way, thematic maps that display socio-economic conditions, such as income levels or education rates, can reveal patterns and disparities within communities. This information helps researchers understand how social factors impact different areas and guide policies to address inequalities.
On the other hand, these maps simplify complex data by visualising it in an easy-to-understand format, making it easier for analysts to identify trends and correlations. If researchers want to study the impact of urban development on local wildlife, a thematic map showing land use changes and wildlife habitats can provide clear insights into how development affects animal populations.
Since they allow you to focus on specific themes, these maps make it easier to analyse data related to particular issues or regions, which can lead to more accurate conclusions and effective solutions.
Providing Geographic Data & Insights
It is an obvious fact that they offer valuable information by showing how different data sets are distributed across various regions.
It has the ability to indicate the population distribution where people live most densely and where areas have fewer residents. This helps to identify regional disparities, such as which parts of Australia are more crowded and which are less populated.
Likewise, a map displaying economic activities can show where industries are concentrated and where economic growth or decline occurs. This insight helps to understand regional economic strengths and weaknesses. Thematic maps also make it easier to spot trends that might not be obvious from raw data alone.
For instance, a map that tracks changes in land use over time can highlight areas undergoing rapid development or those experiencing environmental degradation. These patterns provide a clearer picture of how land use evolves and its impact on the environment.
So, as you witness, through their ability to visualise geographic data, thematic maps make complex relationships and distributions easier to understand. This means that decision-makers, planners, and researchers can use these insights to address issues more effectively, such as planning for infrastructure needs or targeting areas for conservation efforts.
Generating Potent Thematic Maps for Better Understanding of the Land
It is pretty clear that the creation of effective thematic maps greatly enriches your understanding of land-related issues in Australia. By integrating thematic maps into your analytical toolkit, you gain clearer insights into population trends, environmental changes, and land use. Or, in another way, you can purchase a suitable software solution that has embedded mapping technologies like thematic maps, GIS, etc. However, you must connect with a reliable software provider if you expect the best outcome.