
Asset maintenance tends to be one of the most daunting tasks in asset-oriented businesses, for dynamic asset behaviours can lead to dynamic asset fates. Thus, the quality of corporate or industrial fixed assets may vary from one another even when they are manufactured by the same manufacturers on the same date. So how does an asset owner reliably identify the actual asset lifecycle of a multitude of assets in confidence? This is where the Prevention-Failure (P-F) curve comes into play. The P-F curve is a graph asset managers use to measure the approximate maintenance period. Through this graph, asset managers can identify the asset’s reliability and performance over time by assessing the interval between potential failure and functional failure. Consequently, companies rely on this graph to effectively structure their maintenance strategy and reduce downtimes. This blog will describe the P-F curve, its benefits, and its relevance in 2023.
Understanding the Origin and Intricacies of the P-F Curve
Developed by Stanley Nowlan and Howard Heap in 1970, the P-F curve was initially used by the U.S. Defense Department and United Airlines to reduce losses and aircraft downtime. Today, the P-F curve is used by various other industries, including industrial factories and the automobile sector. One of the key reasons why a P-F curve is mandatory for asset managers is because, without an objective mechanism to monitor the criticality of all assets, only assets that frequently fail or cost the most would gain attention. In other words, there was a tendency to forget that all assets could be subjected to risks in the future, heightening the need for managers to monitor the life cycle of each and every asset.
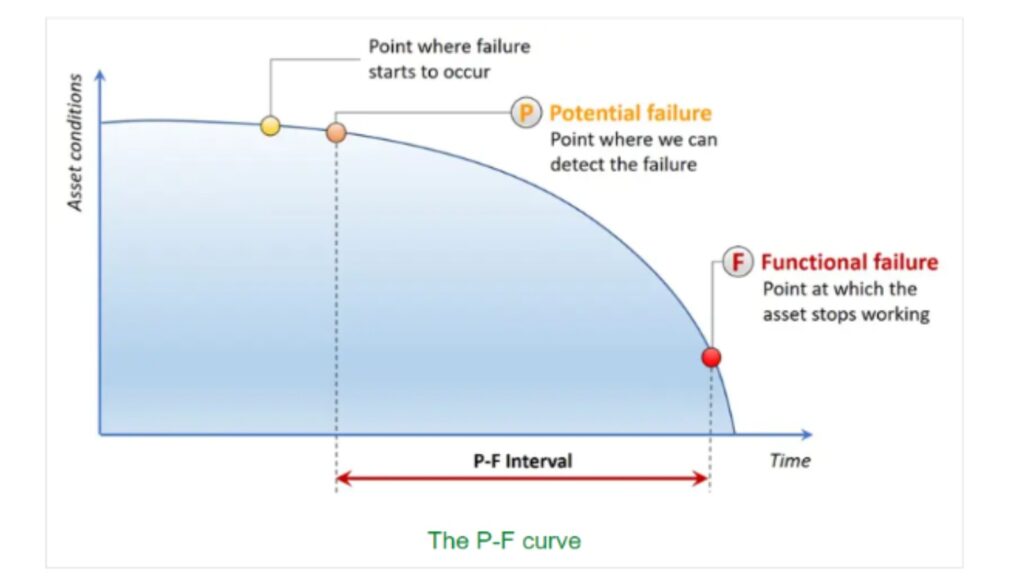
As noted by the term, the P-F curve focuses on two points: The potential failure and the function failure. The former refers to the period when an asset manager notices that the equipment is starting to deteriorate, whereas the latter refers to when the equipment has reached its useful limit and is no longer performing optimally. The time between these two points is known as the P–F interval. If the interval is long, it indicates that the maintenance personnel will have to use more time to detect the failure before it occurs. The P-F curve is part of the Reliability-Centred Maintenance (RCM) framework that considers the most appropriate maintenance technique, be it corrective, predictive or condition-based maintenance, to enhance an individual asset’s reliability, sustainability and uptime.
Relationship Between Maintenance Techniques and P-F Curve

The most suitable maintenance technique will generally depend on the organisation’s goal. Understanding the P-F graph’s role with different maintenance approaches is helpful when making the best decision. Note, however, that some asset managers may use a mix of techniques.
Corrective Maintenance: The two main subcategories under this maintenance technique are run-to-failure and breakdown maintenance. Its central focus is to carry out maintenance after the asset breaks down. This is regarded as the simplest maintenance strategy as it only requires the asset manager to decide whether the asset has failed or not. Contrary to the perception that this form of maintenance is random, it is important to understand that, at times, this is intentional and planned. For example, where the Mean Time Between Failure (MTBF) value is high, corrective maintenance would be the most appropriate strategy because the total cost of regular maintenance over a long period outweighs the cost of repair or replacement.
Preventive Maintenance: As the term indicates, preventive maintenance refers to maintenance carried out before the anomaly occurs. This is often seen as the recommended maintenance strategy in factories that are looking to reduce waste and overall costs. Sometimes, however, if the P-F curve is not accurate, its incorrect intervals would necessitate corrective maintenance to be carried out, removing the very advantage preventive maintenance is meant to provide. Hence, being mindful of the factors affecting the P-F curve (see below) will allow asset managers to accurately understand when the anomaly should be addressed.
Condition-Based Maintenance: This form of maintenance requires managers to have the relevant tools to monitor assets in real-time. In this respect, one can adopt either periodic or continuous monitoring systems. Irrespective of what is selected, asset managers can optimally schedule and carry out maintenance using specialised condition-monitoring sensors. Some experts note that condition-based maintenance is the greatest technique for gaining the best P-F intervals. It would usually have an automated alarm system so that if the health of an anomaly goes beyond acceptable limitations, the asset manager is warned immediately.
Important Factors to Take into Account When Assessing P-F Curves
It is worth conducting visual inspections, vibration measurements and analysis, acoustic emissions, corrosion monitoring, IR thermography, lubricant sampling and more to maximise the P-F interval. However, the issue will be in finding experts or a specialised labour force that have the skill to conduct it. This could be a key reason why companies have, for the longest time, been unable to create strategies based on a P-F curve.
Moreover, when the P-F curve is used to find the probability of an asset failing or performing, it is not enough to simply consider the day it was purchased or the day it was built, for example. Failure identification results can vary based on factors such as the equipment design and the frequency at which the asset was used. Past errors that occurred during installation and operation, in addition to the quality of spare parts added into assets during repairs, will drastically change the P-F interval. Hence, organisations must have an accurate repository of each asset’s historical data in-store when calculating the P-F curve. Having a holistic overview of each asset is thus essential for asset managers to gain the correct P-F intervals.
Are P-F Curves Still Relevant in 2023?

Contrary to the perception that technology has made things easier, it does not mean that the importance of the P-F curve graph has been distinguished. Instead, many expert solutions are built upon the very principles and features of the P-F curve. When investing in a holistic asset management solution, it is imperative to have an intricate understanding of the graph’s function and purposes. Knowledge of these factors would, for instance, help asset managers to identify whether the detection of anomalies and maintenance strategy proposed by a software solution is, in fact, time-saving and financially cost-effective. Equip yourself with the right knowledge and a smart asset maintenance solution suite.