
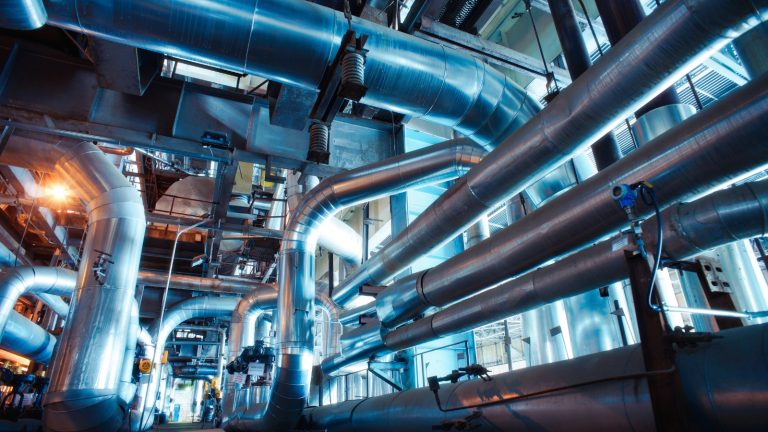
We are witnessing that water utilities are entering a period where renewal decisions can no longer rely on simple asset age assumptions. According to the latest Australian water industry benchmarking data, many utilities continue to experience approximately 12.7 breaks per 100 km across ageing distribution networks. No need to say that this creates growing pressure to optimise renewal spending while maintaining service reliability. In this environment, reticulation pipe renewal prioritisation requires a more scientific methodology that balances engineering risk, economic outcomes, and network performance simultaneously.
Modern utilities are increasingly adopting risk-cost-performance pipe analysis Australia methodologies to identify which pipe segments should be renewed first, which can be rehabilitated later, and which continue to deliver acceptable service despite advanced age. Rather than replacing assets based purely on installation dates, utilities can evaluate actual failure exposure, financial implications, and operational impacts to create defensible investment programmes.
This article explores how utilities can build a comprehensive prioritisation framework using risk, cost, and performance data to maximise long-term network value and support sustainable infrastructure investment.
We will look into
- Why Prioritisation Is the Critical First Step
- What Is Risk-Cost-Performance Analysis for Pipe Renewal?
- How to Assess Pipe Failure Risk
- How to Assess the Consequences of Failure
- How to Build a Lifecycle Cost Model for Renewal
- How Service Performance Data Completes the Framework
- How to Score and Rank Pipes for Renewal
- How Pipe Condition Assessment Validates the Analysis
- How GIS Maps the Renewal Priority Network
- How AI and Digital Twin Strengthen Renewal Decisions
- How to Build a 10-Year Renewal Investment Profile
- Common Mistakes in Reticulation Renewal Planning
- FAQs About Reticulation Pipe Renewal Prioritisation
Why Prioritisation Is the Critical First Step
A structured prioritisation process ensures that limited renewal budgets target assets that create the highest operational and financial risk for the utility.
Key Takeaways
- Risk-cost-performance analysis helps utilities prioritise the right pipes for renewal, not simply the oldest ones.
- Failure risk, consequence, and lifecycle costs should be evaluated together for better investment decisions.
- GIS, AI, and digital twins enable more dynamic and evidence-based renewal planning.
- Long-term investment profiling helps utilities reduce failures while optimising renewal budgets.
Australian Reticulation Networks Spanning Tens of Thousands of Kilometres
Australian water utilities collectively manage extensive distribution infrastructure stretching across metropolitan, regional, and remote service areas.
These vast systems contain pipes of varying ages, materials, diameters, and environmental conditions. It makes blanket renewal strategies ineffective and economically unsustainable for long-term asset management.
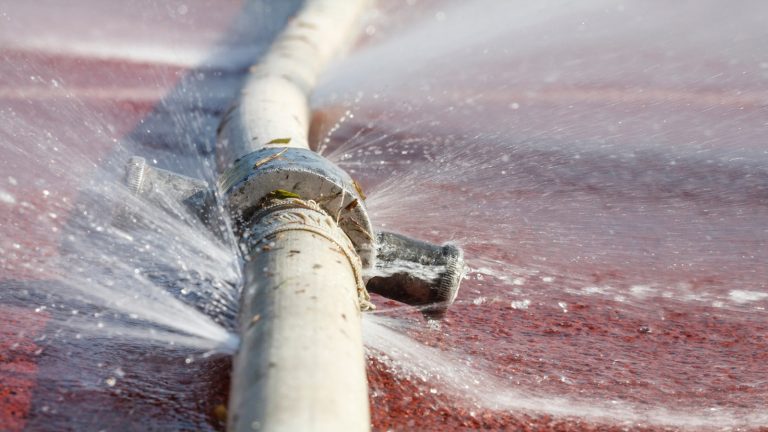
12.7 Pipe Breaks Per 100 Km Demanding Smarter Renewal Decisions
Not to mention that break incidents generate repair costs, customer disruption, traffic impacts, and operational inefficiencies.
As failure frequency increases across ageing assets, utilities require advanced decision-making processes that identify which pipe segments contribute disproportionately to overall network risk exposure and maintenance expenditure.
Why Renewing by Age Alone Wastes Capital on the Wrong Pipes
Pipe age remains a useful indicator, but it rarely reflects actual asset health. Do you agree?
Some assets continue performing effectively decades beyond expected design life, while others deteriorate prematurely due to environmental and operational conditions.
This makes age-only renewal programmes highly vulnerable to inefficient spending outcomes.
Risk-Cost-Performance Analysis: Delivering Scientifically Defensible Priorities
If they can evaluate risk exposure, financial implications, and operational performance simultaneously, utilities can establish transparent investment decisions supported by objective evidence.
This approach enables reticulation pipe renewal prioritisation programmes that withstand scrutiny from regulators, auditors, engineering teams, and financial stakeholders.
What Is Risk-Cost-Performance Analysis for Pipe Renewal?
Risk-cost-performance methods combine engineering, operational, and financial data to rank renewal candidates based on measurable business value.
Combining Failure Risk, Renewal Cost, and Service Performance Data
A comprehensive water reticulation renewal framework integrates multiple data sources, including asset inventories, maintenance records, operational performance indicators, hydraulic information, and financial projections.
Combining these perspectives produces a more balanced assessment of network renewal requirements than isolated engineering metrics.
How the Three Dimensions Produce a Ranked Renewal Priority List
Risk evaluates failure exposure, cost assesses financial implications, and performance measures service delivery effectiveness.
Together, these dimensions create prioritisation scores that identify assets delivering the greatest potential benefit when renewed, allowing utilities to allocate resources strategically.
Why Single-Factor Approaches Miss Critical Renewal Candidates
Programmes based solely on break history, age, or replacement cost often overlook important operational risks.
Assets with moderate failure rates may still create severe service consequences, while low-cost replacements may generate minimal network improvement despite consuming valuable budget allocations.
Applying the Framework Across Reticulation Networks of Any Scale
Whether managing a regional township or a metropolitan distribution system, the methodology remains scalable.
Utilities can apply consistent scoring criteria across thousands of kilometres of infrastructure while maintaining flexibility to accommodate local operational priorities and asset management objectives.
How to Assess Pipe Failure Risk
Failure risk assessment quantifies the probability that individual pipe segments will experience future deterioration or breakdown events.
Failure Probability Scores From Pipe Age, Material, and Break History
Risk models typically calculate pipe failure probability using historical failure records, installation age, operating conditions, and observed deterioration patterns.
By analysing multiple variables together, utilities can generate more accurate forecasts than relying on historical break frequencies alone.
Soil Corrosivity and Ground Movement Accelerating Failure Rates
Environmental factors significantly influence asset deterioration.
High soil corrosivity, aggressive groundwater chemistry, unstable soils, and repeated ground movement can accelerate wall thinning, joint degradation, and structural weakening.
It increases long-term vulnerability across affected pipeline corridors.
Pressure Transient Stress as an Underestimated Failure Driver
Hydraulic surges generated by pump operations, valve closures, and emergency shutdown events often impose repeated stress cycles on pipe walls.
Over time, these transient loads contribute to crack propagation and fatigue failures that may not be visible through conventional inspection methods.
AI Models Generating Dynamic Failure Probability Per Pipe Segment
Modern utilities increasingly deploy AI pipe failure model technologies that continuously analyse operational data streams.
These systems use machine learning algorithms and predictive analytics techniques to identify changing deterioration patterns and update risk forecasts as new information becomes available.
How to Assess the Consequences of Failure
Understanding impact severity helps utilities identify assets whose failure would create the greatest organisational and community disruption.
Consequence Severity by Service Zone, Population, and Criticality
A comprehensive pipe failure consequence assessment evaluates service area characteristics, customer density, operational dependency, and asset criticality.
Pipes supplying hospitals, industrial precincts, and major population centres typically receive higher consequence ratings than less critical network segments.
Customer Minutes Lost and Supply Disruption From Each Failure Event
Utilities often quantify service impact using customer minutes lost metrics.
These calculations estimate the duration and scale of water outages resulting from individual asset failures. It provides measurable insight into the operational consequences of network disruptions.
Infrastructure Damage, Road Closures, and Repair Costs Per Incident
Pipe failures frequently extend beyond water loss. Major incidents may damage surrounding infrastructure, disrupt transport networks, and require extensive excavation activities.
These secondary impacts often represent a substantial portion of total failure-related expenditure and community inconvenience.
Weighting Consequence Scores to Reflect Asset Strategic Importance
Utilities can adjust scoring methodologies to reflect local priorities and organisational objectives.
This ensures that the consequences of failure evaluations appropriately recognise critical service obligations, regulatory expectations, and strategic infrastructure dependencies across the broader distribution system.
How to Build a Lifecycle Cost Model for Renewal
Lifecycle costing provides the economic foundation required to justify and optimise long-term renewal investments.
Estimating Full Renewal Cost Per Pipe Segment and Material Type
Accurate renewal cost estimation requires consideration of excavation complexity, reinstatement requirements, traffic management, contractor availability, and material selection.
Costs vary considerably depending on asset location, pipe diameter, depth, and construction methodology.
Comparing Rehabilitation vs Full Replacement Cost Scenarios
Evaluating rehabilitation vs replacement options allows utilities to identify the most economically efficient intervention strategy.
In many cases, trenchless rehabilitation methods can extend asset service life while reducing construction disruption and overall project expenditure.
Including Emergency Repair Cost Avoidance in the Renewal Case
Business cases should account for avoided reactive maintenance spending.
Repeated emergency repairs often consume significant operational resources, increase customer disruption risks, and divert budgets away from planned infrastructure improvement initiatives.
Building 10-Year Investment Profiles Across the Reticulation Portfolio
Long-range planning requires lifecycle cost pipe renewal Australia methodologies that evaluate future funding requirements.
This is where utilities can establish staged programmes that align investment timing with expected deterioration patterns, operational priorities, and organisational budget constraints.
How Service Performance Data Completes the Framework
Service performance metrics reveal how effectively assets support operational objectives and customer expectations across the distribution network.
Tracking Break Frequency Index Per Pipe Segment Over Time
Monitoring the break frequency index enables utilities to identify recurring failure hotspots that may not be immediately obvious through annual maintenance reports.
Trend analysis over multiple years provides stronger evidence of deterioration patterns and helps validate future renewal priorities.
Non-Revenue Water Loss Rates: Highlighting Performance Outliers
High levels of non-revenue water often indicate hidden leakage, unauthorised consumption, or asset deterioration.
Pipe segments exhibiting persistent water losses frequently emerge as high-priority candidates for intervention because performance deficiencies directly affect operational efficiency and revenue recovery.
Comparing Actual vs Desired Reticulation Performance Benchmarks
Utilities should compare observed service outcomes against established targets.
Measuring key indicators such as pressure stability, interruption frequency, repair response times, and overall reticulation network performance helps determine where infrastructure deficiencies are affecting service delivery objectives.
Weighting Renewal Priority by Service Performance Deficit Severity
A pipe segment with persistent operational issues may warrant accelerated renewal despite moderate failure risk.
Incorporating a service performance KPI weighting ensures assets causing measurable service deficiencies receive appropriate consideration within the overall prioritisation methodology.
How to Score and Rank Pipes for Renewal
A structured scoring methodology converts complex engineering data into actionable investment priorities.
Combining Risk, Cost, and Performance Scores Into a Composite Index
Utilities often calculate weighted scores that incorporate risk exposure, financial implications, and operational outcomes.
This multidimensional approach strengthens reticulation pipe renewal prioritisation by ensuring decisions consider the full range of technical and business impacts associated with each asset.
Segmenting Pipes Into Renewal Tiers by Composite Priority Score
Once scores are calculated, assets can be grouped into high, medium, and lower-priority categories.
Tiering simplifies programme planning, enables more effective resource allocation, and helps establish clear renewal schedules aligned with organisational objectives.
Validating Rankings Against Field Inspection and Condition Data
Desktop analysis should always be verified using field evidence.
Inspection results, maintenance records, and observed deterioration indicators help confirm whether prioritised assets genuinely represent the highest-risk components within the network.
Producing an Auditable, Defensible Renewal Priority List
Transparent methodologies create confidence among regulators, auditors, and executive stakeholders.
A documented process for pipe renewal prioritisation demonstrates that investment decisions are supported by measurable evidence rather than subjective judgement or historical practice.
How Pipe Condition Assessment Validates the Analysis
Field-based condition information provides essential validation for model-generated renewal priorities.
CCTV Inspection Confirming Internal Condition of Priority Pipes
Targeted CCTV pipe inspection programmes allow engineers to identify cracks, deformation, corrosion, root intrusion, and structural defects within critical assets.
These observations provide valuable confirmation of deterioration assumptions generated through analytical models.
Acoustic Surveys Detecting Active Leaks in High-Priority Segments
Advanced acoustic leak detection technologies identify hidden leakage before visible surface failures occur.
Detecting active water loss helps utilities verify deteriorating assets and improve confidence in prioritisation outcomes before committing significant renewal expenditure.
Laser Scanning Quantifying Structural Parameters for Renewal Decisions
Modern laser scanning systems generate highly accurate geometric measurements that reveal wall deformation, ovality, and structural degradation.
These objective assessments support engineering evaluations and improve understanding of actual asset condition across critical network sections.
Condition Grades Feeding Directly Into Risk-Cost-Performance Scores
Each asset can be assigned a pipe condition grade derived from inspection results. Integrating this information into the scoring methodology strengthens decision quality by linking renewal priorities directly to observable physical deterioration rather than inferred assumptions alone.
How GIS Maps the Renewal Priority Network
Spatial intelligence transforms complex asset datasets into visual decision-support tools for planners and field teams.
City-Scale GIS Maps Displaying Renewal Priority by Pipe Segment
Modern GIS renewal mapping platforms provide planners with a comprehensive city-scale pipe view of renewal priorities.
Colour-coded visualisation enables rapid identification of high-risk areas and helps communicate investment strategies to both technical and non-technical stakeholders.
Replacement Prioritisation Maps Built From ArcGIS Layer Analysis
A detailed replacement prioritisation map can be generated through layered analysis of asset condition, hydraulic performance, failure history, and environmental factors.
This visual representation improves planning efficiency and supports evidence-based infrastructure management.
Overlaying Soil, Pressure, and Break History Data Spatially
Spatial analysis becomes more valuable when multiple datasets are combined.
Integrating pressure zones, historical failures, environmental risks, and pipe material vulnerability characteristics enables deeper insight into the drivers influencing network deterioration.
Field Crew Deployment Guided by GIS Priority Zone Visualisation
Operational teams benefit from location-based prioritisation outputs.
Visual maps help coordinate inspections, maintenance activities, and construction programmes by directing resources towards areas that present the greatest risk exposure and operational benefit.
How AI and Digital Twin Strengthen Renewal Decisions
Advanced digital technologies enhance the accuracy, responsiveness, and long-term effectiveness of renewal planning.
AI Dynamically Updating Failure Probability as New Data Arrives
Traditional risk models often rely on static datasets updated periodically.
Modern AI pipe renewal prioritisation systems continuously process sensor information, maintenance records, and operational data streams to improve forecasting accuracy and responsiveness.
Digital Twin Simulating Performance Impact of Renewal Scenarios
A digital twin reticulation environment enables utilities to test alternative renewal strategies before committing capital.
Engineers can evaluate network behaviour under different investment scenarios and better understand expected operational outcomes.
Testing Rehabilitation vs Replacement Options in the Virtual Model
Simulation tools help compare intervention strategies across varying asset conditions.
By modelling expected performance improvements, planners can determine whether rehabilitation or replacement provides greater long-term value under specific network circumstances.
Continuously Refining the Renewal Priority List From Live Sensor Data
Real-time monitoring supports adaptive decision-making.
As operating conditions evolve, prioritisation rankings can be updated automatically. This ensures investment plans remain aligned with emerging risks, changing performance trends, and newly identified deterioration indicators.
How to Build a 10-Year Renewal Investment Profile
Long-term investment planning allows utilities to balance affordability, risk reduction, and infrastructure sustainability across multiple budget cycles.
Spreading Renewal Capital Across Annual Funding Cycles Smartly
A successful renewal programme avoids large spikes in expenditure by distributing projects across multiple years.
Strategic scheduling helps utilities manage capital expenditure more effectively while maintaining consistent progress in reducing network risk and infrastructure deterioration.
Matching Renewal Spend to Predicted Failure Curves Per Tier
Investment timing should align with expected deterioration patterns.
Assets demonstrating a higher likelihood of failure typically require earlier intervention, while lower-risk segments can remain in service longer without compromising operational objectives or customer outcomes.
Scenario Modelling Optimising Spend Under Different Budget Constraints
Utilities frequently face competing investment priorities and funding limitations. Scenario modelling enables planners to compare alternative strategies, identify acceptable risk levels, and determine how budget adjustments influence overall programme effectiveness and service outcomes.
Presenting Investment Profiles to Regulators and Finance Teams
Decision-makers require clear evidence supporting infrastructure expenditure proposals.
A structured 10-year investment profile reticulation strategy demonstrates how planned investments reduce risk, improve service performance, and support sustainable network management over extended planning horizons.
Common Mistakes in Reticulation Renewal Planning
Avoiding common planning errors significantly improves renewal outcomes and helps maximise long-term asset value.
Renewing by Pipe Age Without Condition or Consequence Data
Age-based programmes frequently overlook the actual condition and operational importance of assets.
Pipes with substantial remaining useful life may be replaced prematurely, while more vulnerable infrastructure remains exposed to escalating deterioration and failure risks.
Ignoring Cumulative Failure Cost in the Renewal Business Case
Repeated repairs create substantial long-term expenditure.
Utilities that fail to incorporate cumulative maintenance costs into lifecycle cost modelling often underestimate the economic benefits associated with proactive infrastructure renewal and strategic investment planning.
Under-Investing in High-Consequence Low-Probability Failure Pipes
Some assets fail infrequently but create severe impacts when breakdowns occur.
Neglecting these critical segments can expose utilities to significant operational, reputational, and regulatory consequences despite relatively low observed failure rates.
Deferring Renewal Until Emergency Repair Costs Escalate Rapidly
Postponing intervention often increases risk exposure and future expenditure.
As deterioration accelerates, assets experience a higher degradation rate, leading to more frequent failures, greater service disruption, and escalating reactive maintenance requirements.
Why Choose Tigernix for Reticulation Renewal Prioritisation?
Tigernix offers a robust Reticulation Asset Solution that provides advanced asset intelligence tools that help utilities optimise renewal investment decisions using data-driven methodologies.
Risk-Cost-Performance Analysis Built Into the Reticulation Platform
The Tigernix platform incorporates comprehensive risk-cost-performance analysis capabilities that evaluate engineering, operational, and financial factors simultaneously.
This enables utilities to establish evidence-based renewal priorities that support long-term infrastructure performance and investment optimisation.
AI Pipe Failure Models Updated Continuously From Sensor Data
By integrating operational monitoring systems and machine learning technologies, the Tigernix platform continuously updates risk calculations. Dynamic modelling improves forecasting accuracy and helps utilities respond proactively to emerging asset deterioration trends.
GIS Replacement Prioritisation Maps at City and Network Scale
Its integrated visualisation tools support planning activities through advanced spatial analysis. Utilities can utilise ArcGIS reticulation capabilities to identify priority renewal zones, assess geographic risk concentrations, and improve programme coordination across large service areas.
10-Year Investment Profiling Across All Renewal Budget Scenarios
Tigernix enables planners to evaluate alternative funding strategies using advanced scenario modelling. Detailed investment forecasts help organisations optimise expenditure allocation while maintaining acceptable risk levels and achieving long-term infrastructure objectives.
Trusted by Australian Water Utilities Managing Complex Reticulation Networks
Utilities responsible for extensive and diverse distribution systems require scalable asset management solutions. Tigernix supports complex operational environments through advanced analytics, intelligent planning tools, and comprehensive decision-support capabilities tailored to modern water infrastructure challenges.
Tigernix-Establishing A Digital Era
Ready to Prioritise Renewal With Confidence?
Data-driven renewal planning empowers utilities to reduce risk, improve service outcomes, and maximise infrastructure investment value.
Consult Tigernix Reticulation Asset Management, Specialists
Tigernix specialists work closely with utilities to evaluate existing renewal strategies, identify improvement opportunities, and implement advanced analytical frameworks that strengthen infrastructure planning and long-term asset performance.
Call us for a free demo.
Explore Tigernix Reticulation Asset Solution Renewal Capabilities
The Tigernix Reticulation Asset Solution provides integrated tools for risk assessment, performance monitoring, financial planning, and renewal programme optimisation, enabling utilities to make faster and more informed investment decisions.
Deploy Risk-Cost-Performance Analysis Across Your Network Today
Utilities seeking greater transparency and investment confidence can implement reticulation pipe renewal prioritisation methodologies that align engineering evidence, operational requirements, and financial objectives within a single decision-making framework. Through intelligent planning and continuous optimisation, organisations can improve resilience while supporting sustainable infrastructure management outcomes.
FAQs About Reticulation Pipe Renewal Prioritisation
A risk-cost-performance model typically requires asset age, pipe material, break history, hydraulic performance, condition inspection results, customer impact data, renewal costs, and environmental factors. Combining these datasets enables utilities to generate accurate and defensible renewal priorities.
Utilities calculate failure probability using statistical and machine learning models that analyse pipe age, material properties, operating pressure, soil conditions, historical failures, and environmental stressors. These variables produce segment-level risk scores that support proactive renewal planning.
Consequence analysis identifies the operational, financial, and customer impacts of pipe failures. By evaluating service disruptions, critical customer connections, repair costs, and infrastructure damage, utilities can prioritise assets whose failure would create the greatest overall risk.
Digital twin technology creates a virtual representation of the reticulation network that simulates asset behaviour under different scenarios. Utilities can evaluate renewal strategies, forecast performance improvements, and assess risk reduction outcomes before committing capital investments.
Pipe rehabilitation extends asset life by repairing or reinforcing existing infrastructure, often with lower costs and reduced disruption. Full replacement removes and installs new pipe assets, providing longer-term reliability but typically requiring greater capital expenditure.